Author: lsa1wp1admin
New Trade Alert Coming Soon….
Email us with any questions – info@lionstockalerts.com
Using Stock Options Straddle Information To Trade Better
For some of you reading this, you may never trade a single option contract in your life. They’re sort of complicated, don’t offer as great liquidity as other products, and are wasting assets. However, paying attention to the stock options market can still be helpful for those don’t even trade them.
For example, the prices of option straddles give us an indication of what the market is anticipating in terms of volatility. In turn, this information can be used to make  better decisions in terms of position sizing.
Now, there are generally two types of volatility that traders concern themselves with. The first is historical volatility and the second being implied volatility. Historical volatility measures the amount of randomness in a stocks price for a given period. It’s usually measured by the standard deviation of a stock’s price move.
On the other hand, implied volatility is priced on how traders buy and sell stock options. For example, if traders continue to bid up the price of an option, then eventually prices for those options will be greater. If nothing else changed (the stock price didn’t move), then we can say that the implied volatility increased. On the other hand, if there is constant selling pressure in the options, the value of those stock options should decrease (if the stock price hasn’t moved), and implied volatility should be lower.
Here is a real world example. You’re thirsty for beer, and you’re at the supermarket, you can sift through the beer aisle and find a reasonably priced six-pack. There are a ton of different distributors so prices should be pretty competitive. We can say that  volatility is relatively stable. On the other hand, let’s say we are at Madison Square Garden and we’re thirsty for a beer. Since there is only one vendor, and there is no re-entry if you leave the venue, then you’re at the mercy of the market-maker (aka Madison Square Garden). What normally is the cost for a six-pack of beer at the supermarket is what you’ll get for a single cup of beer at the Garden.
In this case, we can say that the high demand and lack of other choices makes volatility relatively high.
Getting back to options, implied volatility gives us the market’s best estimate on how they believe prices will move. An option straddle is a call option and put option (they are either bought together or sold together), they are of the same strike, and generally the option strikes which are closest to where the stock price is trading.
Let’s say the price of a stock is trading at $34.50, we’d look up the values of the $34.50 call and the $34.50 put and combine them.
The stock options expire in 5 days, the calls have a value of $2.20 and the puts have a value of 2.30.
Hypothetically, if you bought the straddle it would cost $4.50. That means you would need the stock price to rise/fall at least $4.50 to make money. In other words, if we take that $4.50 and divided it by the price of the stock ($34.50), we’d get 13%.
By knowing this information, you can position size accordingly. Of course, the market could get it wrong, meaning the stock price moves more or less than this. But generally, it’s a pretty solid estimate using stock options straddle.
What Makes Traders Succesful In Online Stock Trading
Make no mistake about it, there are several different strategies and techniques that can be applied to make money in the markets with online stock trading. Although they may have different strategies, successful traders do share many things in common even if how they get their results varies. Too often, newbie traders are so

focused on the strategy, that they think it’s the end all be all, but that’s simply not true.
First, successful traders have a plan. They’ll go into a trade measuring what their potential profit and losses might be, before they place the trade. This includes their decision on how they will enter the trade, they might go all in or scale into the position. But the most important takeaway is they have a plan.
Second, they have the discipline to stick with their plan. The discipline comes from repetition, studying similar setups, or even backtesting and forward testing. They have studied past trades and identified what has worked, what currently works and what is not working at the moment. In other words, they are prepared.
If you’re unsure of your strategy, don’t have an outline of your exit, you’re more likely to make emotional decisions when things don’t workout your way. You might panic and not capitalize, or even worse, end up doing something dumb and losing money online stock trading.
Successful traders do not take losing personal. Again, they look at the markets in probabilities. Basically, they’re looking for high probability setups. If it doesn’t work  out, they’ll access their trading plan and see if there is anything they could have done differently. But just because a trade doesn’t work out, it doesn’t mean they will stop trading the strategy if they believe it’s still effective. Sometimes unexplainable things do happen in the market, and that is something you have to learn to be OK with.
With that said, they focus on their strengths first and work on their weaknesses second. For example, Nike first came out as a shoe company that focused on runners. After they built that side of the business up, they moved onto creating sneakers for other sports. Eventually they expanded to apparel and a ton of products.
That is a solid approach to becoming a successful trader with online stock trading. Develop one or two bread and butter trades and then try to expand to other strategies. Don’t try to do everything at once. Also, don’t get frustrated if you can’t make money trading a certain way, maybe that doesn’t fit your personality or risk tolerance.
Successful traders spend a lot of time reviewing their performance, journaling and searching for methods to improve. Their goal is to scale up their operation to the highest level it can reach. They take a business approach to trading and focus on risk vs. reward. A special emphasis is placed on risk management. What good is your online stock trading if you win 5 straight trades and let one wipe all those gains away?
As you can see, risk management is extremely important. Some traders in online stock trading can trade the similar strategy, but one can have superior results based on how they manage risk, control their emotions, and execute the game plan.
It’s not always about your strategy, it’s sometimes more about the intangibles that will make you into a successful trader in online stock trading.
Should You Pay A Subscription for Good Penny Stocks?
Let’s face it, there are vultures in every industry – including good penny stocks. You see it a lot in the diet and health industry, companies promoting fads, in hopes you take the bait and bite. You might catch an infomercial on the weekends on that can’t-miss money making opportunity. When it comes to investing and trading, there  are hoards of individuals pitching you indicators, strategies, and alerts.
Does it ever make sense to sign up and pay for a subscription service pertaining to good penny stocks?
Before I share my opinion, let’s think about it for a second. The more competition, the more efficient the market is and the lower the profit margin. For example, let’s say you are at the supermarket and you’re interested in buying a package of hot dogs. You sift through the aisle and see that there are a number of different brands offering hot dogs. You’ll also notice that prices are relatively comparable. The reason being competition.
Now, imagine that you’re at Yankee Stadium and you’re hungry for a hot dog. You go to the vendor and notice that the price of a hot dog is the same price for 15 hot dogs at the grocery store.
Sounds crazy right?
Well, Yankee Stadium has no competition, you either buy their hot dog, or you don’t buy a hot dog at all. They have no competition, and therefore, they can set prices however they want. With that said, they have a very high profit margin.
Now, imagine that there is a trading strategy for good penny stocks that does very well in the market, meaning that it yields a good profit and has a high probability of  being successful. As more traders pick up on this, competition rises and profits become smaller and smaller. To compensate, traders will have to lever up just to get the same type of returns they were getting before. Eventually there will be too many traders in and the strategy has minimal effectiveness.
With that said, I’d be very cautious on anyone selling special indicators or signals. On the other hand, trading rooms, research, and even stock picking services can still be useful.
At the end of the day, there is only so much you can keep your eyes on, in respect to the market. The more qualified eyes, the better. You can learn a lot from good traders, as well as bad trader. Working on idea generation is one of the most important activities as a trader. You see, after a while, some strategies simply stop working, if you don’t work on ideas you’ll eventually be irrelevant. That’s why you’ll hear a lot of traders from the 1990s and 2000s struggle today, they never made the proper changes and are now obsolete – completely out of good penny stocks.
All in all, idea generation services are worth it, even if they are really bad in their picks. Because if they are awful, you can take the other side of their trades and be profitable. On the other hand, services that offer you how to trade or sell you a signal or strategy, the more users they get, the less effective they’ll eventually be.
Most professional traders trade in teams. They share their ideas with a select group of other traders they trust. Just make sure if you do decide to pay for a service, it’s something that fits your budget. Most services offer trials so make sure to test a bunch out before deciding what fits your trading style the most when trading good penny stocks.
Value Stocks And Event Risk When Trading ETFs and ETNs
Today I had a cup of coffee, some oats and orange juice for breakfast.
And you know what?
Outside of this being a nutritious meal these are tradable assets.
They can either be traded as value stocks on the futures market or through the equity markets, via ETFs and ETNs.
Commodities are called “hard assets” and are typically categorized in these groups: Softs, Meats, Grains, Metals and Energies.
Softs: cotton, orange juice, sugar, cocoa and cotton.
Meats: live cattle, feeder cattle and lean hogs. 
Grains: wheat, corn, soybeans, soybean meal, soybean oil, oats and rough rice.
Energy: crude oil, brent crude, heating oil, gasoline, natural gas and ethanol.
Metals: gold, silver, copper, platinum and palladium.
Commodity prices are driven by the forces of supply and demand. We can also say that they’re hedges against inflation when trading value stocks. During periods of inflation, commodities help preserve purchasing power.
Now, if you decide on trading ETFs or ETNs on these hard assets… it’s important that you become familiar with the event risks involved. Of course, it’s not a one size  fits all type of thing, so let’s take a look at some of the event risks that traders should think about when trading value stocks in commodity ETFs or ETNs.
Event Risk #1: Weather
As mentioned earlier, commodity prices are driven by supply and demand forces. Of course, weather can play a major role. For example, floods in India could affect cotton supply (one of the world’s largest producers) and cause prices to shoot up. Bad weather has the potential to cause supply disruptions. In 2005, Hurricane Katrina caused damage to U.S. oil refineries in the Gulf of Mexico…causing crude oil prices to skyrocket.
Event Risk #2: Economics & Policy with Value Stocks
During periods of fear…investors will get out of risky assets, like stocks, and flock towards “safe havens” like bonds and gold. In 2011, Gold hit a record high because of fears that the European debt crisis would create massive inflation. Gold is very unique in that is seen as a hedge against inflation as well as a safe haven. Silver on the other hand, does not have that distinction.
 Always ask yourself what things mean in terms of supply and demand. For example, let’s say that China’s economy is showing signs of slowing down. What do you think that’s going to do the price of crude oil? This will most likey cause prices to shift sideways or down.
With that said, one of the key tools that central banks have is the ability to make changes to interest rates. Policy changes can affect commodities and stocks greatly if they’re not anticipated by the markets. Generally, central banks will try to prepare markets before they make significant changes to key interest rates in value stocks.
Event Risk #3: Geopolitical Risk
Commodities are natural resources…their prices are vulnerable to shocks…especially in countries in which they’re large suppliers or consumers of the product.
For example, back in March of 2104, Brent Crude oil prices spiked because of fear that Russia’s Vladimir Putin might cut gas flow. In May of 2014, Crude oil prices traded above $100 per barrel…due to concerns of tensions escalating in the Ukraine.
Summary
Now, if you’re trading value stocks that are highly correlated to commodities it’s important to be aware of the added volatility. For example, if the FOMC has a meeting announcement, it shouldn’t be a big surprise to see greater volatility in gold miners or gold ETFs. With that said, if there is uncertainty leading up to the event, it might make sense to lighten up your position or even hedge.
Stock Analysis And Event Risk In Equities
Imagine being long shares of a clothing retailer because you liked the short-term price pattern and felt that it was poised to break-out after some stock analysis. The following day one of its competitors had disappointing earnings and both stocks took a hit towards the downside.
Now, had you known how closely correlated both stocks were, and that one of them had earnings, you might have lightened up on your position or closed it out because you felt that earnings are a 50/50 coin toss.
In any event, a situation like this could have easily been avoided if you had just done your homework, i.e., better stock analysis. However, for the novice trader, these are scenarios that don’t even cross their mind. With that said, there are certain events that you need to be aware of before you decide to hold onto a position.
Let’s take a look at some of them.
Earnings
Many trading platforms today will have notifications on when earnings are. However, if yours doesn’t, it’s not the end of the world because that information is rather easy to find when doing stock analysis. For example, let’s say you took a long position in Gap Stores on November 5th and were considering holding it long for awhile. You could go to finviz.com and find their earnings information on their site.
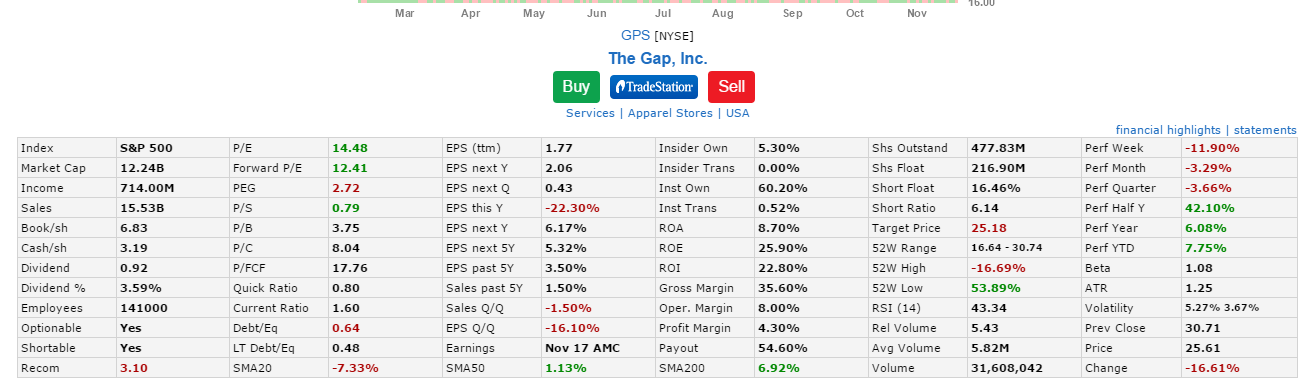
(source: finviz.com)
As you can see, they have earnings on November 17. With that in mind, you’ll have to ask yourself if that can interfere with your thesis or not. In addition, you should also confirm by going to the company website and checking out their investor relations page.
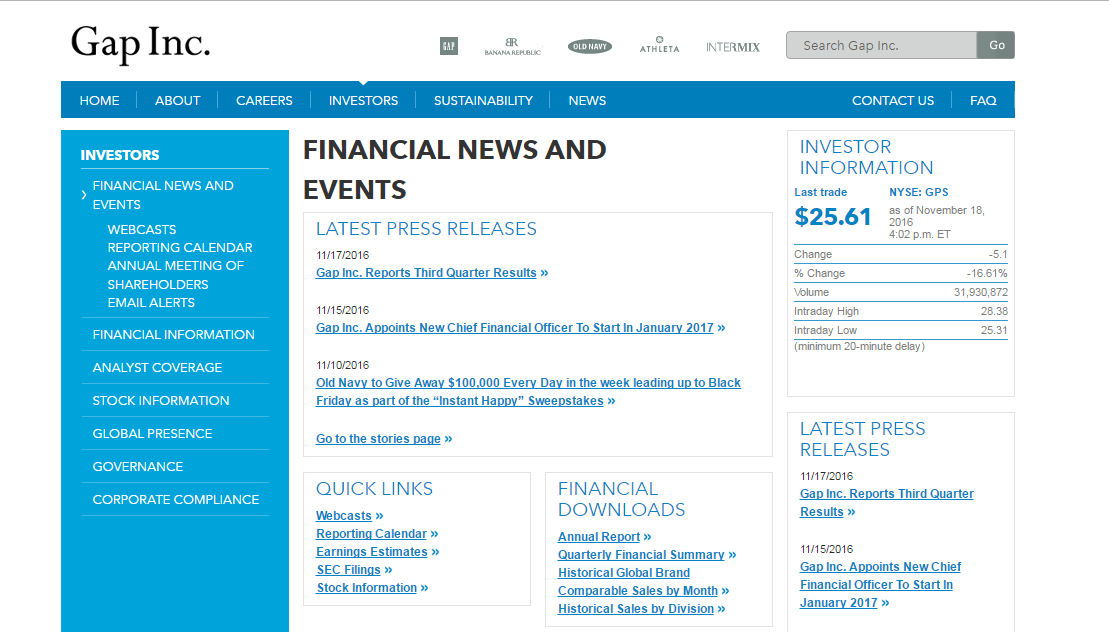
(source: www.gapinc.com)
Generally, the company website is the most reliable source for dates such as earnings when conducting stock analysis.
Competitor Earnings
In some niche industries, how a competitor does on earnings could be an indication on how others in the same space might perform. In this case, the clothing retailers industry is one of those niche industries.
What you’ll need to do is look up the dates of competitors to see if they have earnings around the period you intend on holding your position. You can find a list of similar companies on finviz.com. For example, The Gap, Inc. is categorized as an Apparel Store.
By clicking on the apparel store link, a list of apparel stores will come up.
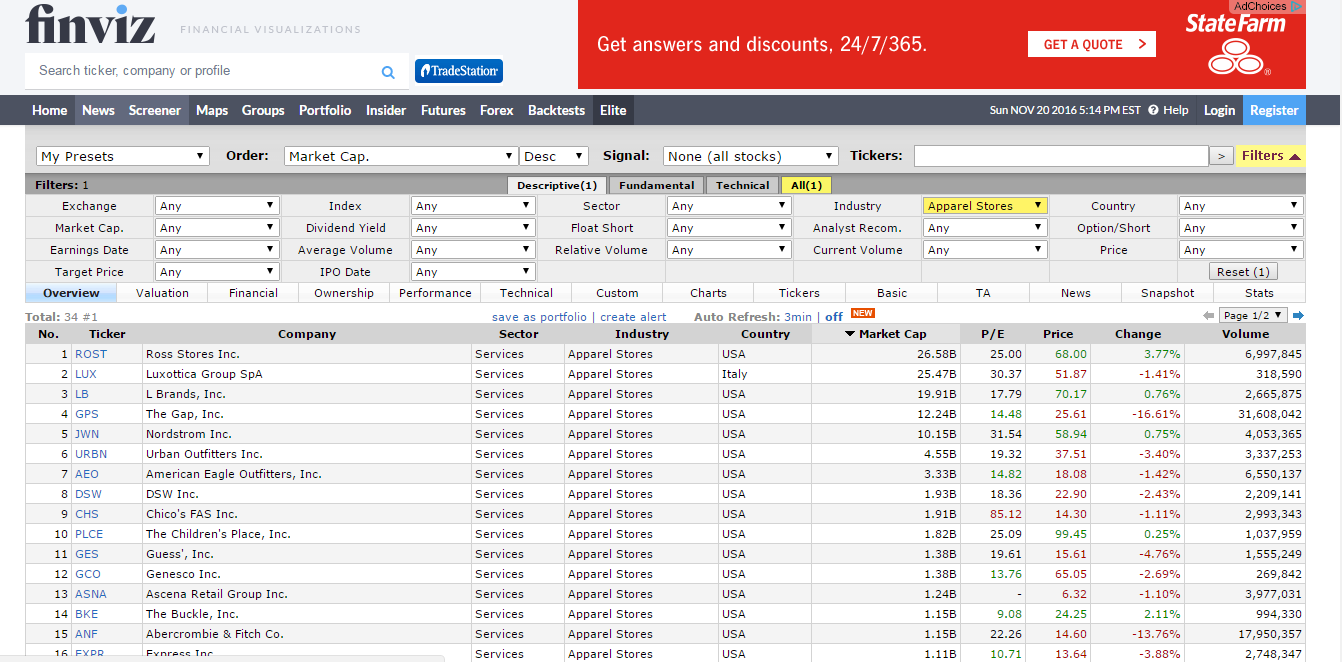
(source: finviz.com)
You’d simply sift through the ones that are similar to see if any of them have earnings coming up.
Industry Reports
Sticking with our example, some clothing retailers will share numbers ahead of earnings, like holiday sales numbers or even give out forecasts. Now, if you’re trading energy related stocks, you’ll want to be aware of the EIA Petroleum Status Report which is generally on Wednesday.
Economic Reports
If you’re trading home builders you want to know when new home sales are released. If you’re trading banking or gold mining stocks, you want to be aware when the FOMC or other central banks have meetings lined up. A basic economic calendar can be used to find this information out. For example, econoday.com does a nice job of laying out this information.
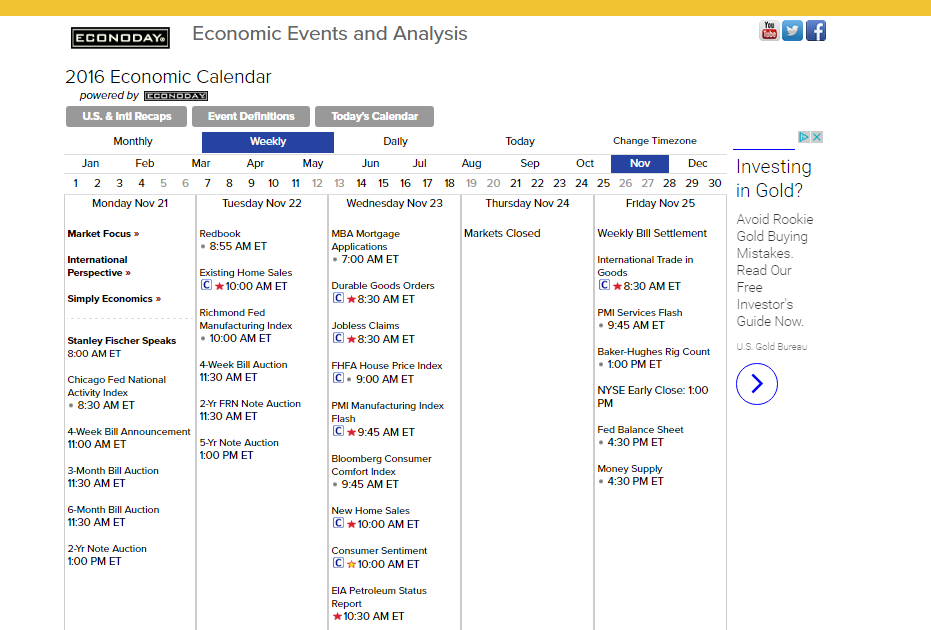
(source: www.econoday.com)
In summary, risk can be mitigated by simply making yourself aware of the events surrounding the stocks you’re trading. Of course, somethings we can’t predict, like when an analyst upgrades or downgrades a stock. But if it’s a known event, be ready and act accordingly after conducting stock analysis.
Use Volatility To Trade Top Penny Stocks
They say volatility creates opportunities in trading top penny stocks. For those not familiar, volatility is something that is attempted to be measured, the most generally accepted method of measurement is the standard deviation. The standard deviation is expressed in annualized % terms, and tell us how much prices deviate from the mean.
In other words, standard deviation is a statistic that measures the amount of  variability around the mean.
Let’s say the price of a stock is trading at $10, and has a historical volatility of 30%. As mentioned earlier, standard deviation is measured in annualized terms. We would take the stock price and multiply it by 0.30, which gives us the number 3.
A one standard deviation move encompasses about 68% of the normal distribution. In this example it means that there will be a 68% chance that the stock price will be within $7 to $13 on the year. On the other hand when trading top penny stocks, to get a two standard deviation, we simply multiply our first figure by two. In this example it’s 6.
According to our historical volatility, there is a 95% chance the stock price will be trading within $4 and $16 on the year.
Now, we mentioned that historical volatility is expressed in annualized terms. However, you can convert that into a daily volatility if you wished when trading top  penny stocks. In order to translate the annualized volatility, take the number of trading days in the year and square root them. Generally there are around 252 trading days in the year, when you square root that, you get 15.87.
So, if we have an annualized volatility of 30% we take that number and divide it by 15.87. In return, we get a number of 1.89%. That means on average we can expect it move within a +/- 1.89% on any given day.
In general, volatility is mean reverting. Periods of high volatility are usually followed by periods of lower volatility, and vice versa. Traders can use this information to size their top penny stocks trades better.
For example, let’s assume volatility has expanded. If you’re aware of that, you might want to trade smaller to compensate for the wilder swings. In addition, under higher volatility, you can make or lose with less shares because the price swings are greater.
In most cases, volatility expands when stocks experience downward pressure. The move towards the downside is usually quicker, when compared to when stock prices  rise. When stock prices rise, they tend to grind up.
With that said, you can use volatility to gauge fear and greed in the market when trading top penny stocks. The most commonly used metric for the overall market is VIX. The VIX more or less tells us about the volatility in the S&P 500 index. A low VIX means there is little fear in the market, a higher VIX means there is fear.
In summary, knowing the volatility of a stock can help in your position sizing. You might be able to use those numbers to gauge sentiment in the stock as well. For a bigger picture perspective, the VIX can be used to measure gauge fear and greed in the overall market when trading top penny stocks.
How To Avoid Style Drifting When Trading Today’s Stock Market
The more successful and experienced you become as a trader, the more in touch you are with your strengths and weaknesses. Just like a pitcher in the MLB, they are aware of what types of pitches they throw that give the opposition difficulty. On the other hand, a good trader can tell you what their bread and butter trades are in today’s stock market.
However, from time to time, you’ll hear about other traders making large sums of  money doing something that you’re not exactly well versed at. So, instead of trying to learn what exactly they see, you blindly jump in with profits on your mind.
Generally, when you can’t explain why you’re in a trade, along with the exit points, you’re already on shaky grounds. However, it’s human nature to get caught up into something, but it should still be our main focus.
The worst is when you take on a trade that is out of your wheelhouse, and it ends up eating away at entire day’s profits. This type of behavior is often referred to as style drifting. Style drifting is one of the worst habits to have as a trader in today’s stock market.
How can you avoid style drifting in trading?
Well, an easy way is to consistently reinforce yourself what your bread and butter trades are. By categorizing your trades, you’ll be able to figure which ones are the best based on P&L. On other hand, you’ll find out which types of trades don’t suit you well. Getting familiar with your own trades will help you focus on what needs to be done in order to be successful in today’s stock market.
 Now, there is nothing wrong with trying new trading strategies. However, these trades should be sized so small that it doesn’t affect your overall P&L. If you’re trading was conducted like a business, then these new trades are trying to show proof of concept. Once they show enough promise, you then can increase your share size and scale up.
With that said, keeping a trading journal is extremely important. There is no way you’ll be able to remember every single trade in your head. Eventually your brain gets foggy, and you tend have selective memory when it comes to your trading. However, a detailed journal will allow you to refresh your memory and walk through the entire process over again for today’s stock market.
Not only that, but it will keep you accountable for your actions. For example, some traders might plead ignorance as their defense for putting on a bad trade. But if they  only studied their performance, they would know exactly how they fared on specific types of plays.
As noted earlier, you should always work on your skills and new ideas. But always focus on your bread and butter trades, and see how they can be better. If you’re unsure of what they are, it could lead to style drifting, trading aimlessly without a plan. A great way to avoid style drifting is to review and journal your trades. Style drifting happens to everyone, but the better traders make it less and less of a habit in today’s stock market.
How To Profit From The Sympathy Play When Trading Blue Chip Stocks
On November 9th, 2016, it was announced that Donald Trump would be the 45th President of the United States In America. When the markets opened that day we started to see money flow from certain sectors into others. Intuitively, this makes sense, a new regime and potentially new policies will be enforced. Some industries will thrive, while others might suffer with blue chip stocks.
One sector that was resurrected, where the shippers of dry bulk cargo. For example, DryShips, Inc. finished that week up more than 195%.
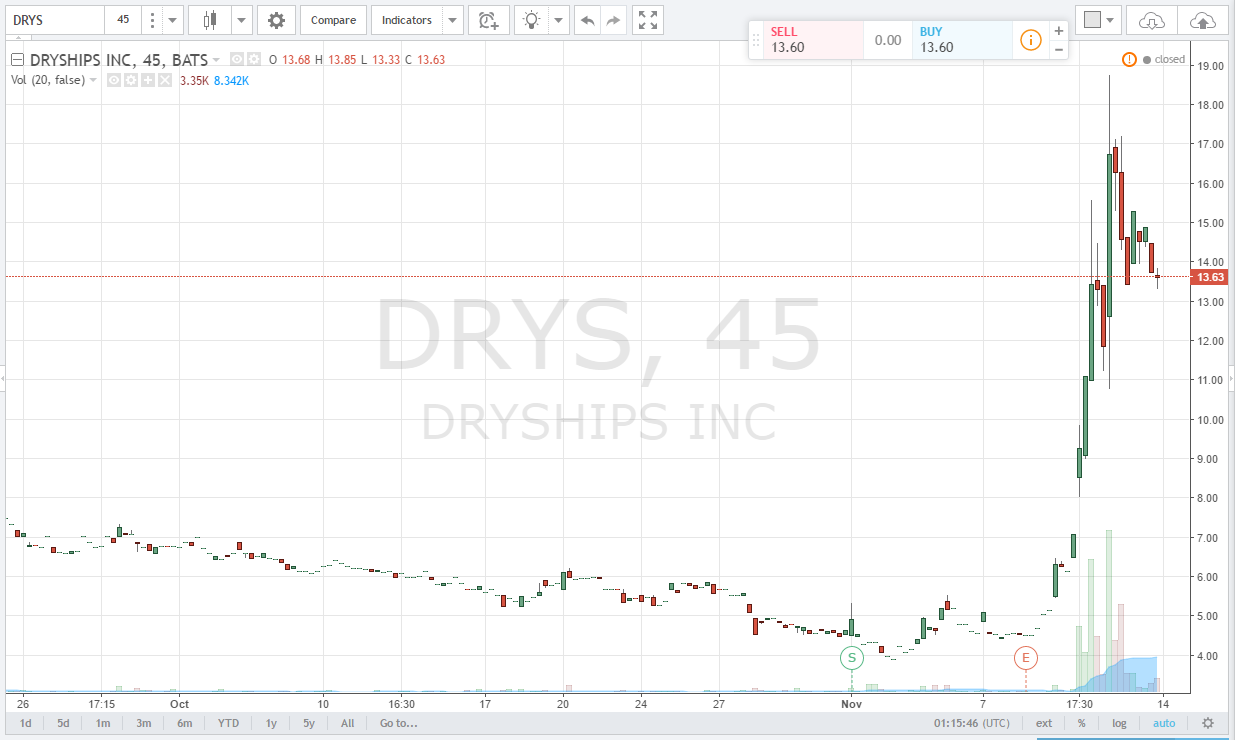
(source: TradingView.com)
The stock price spiked from about $5 to as high as about $19 a share in a couple days. According to YAHOO! Finance, more than 25% of the shares were short, creating a short squeeze in the blue chip stock.
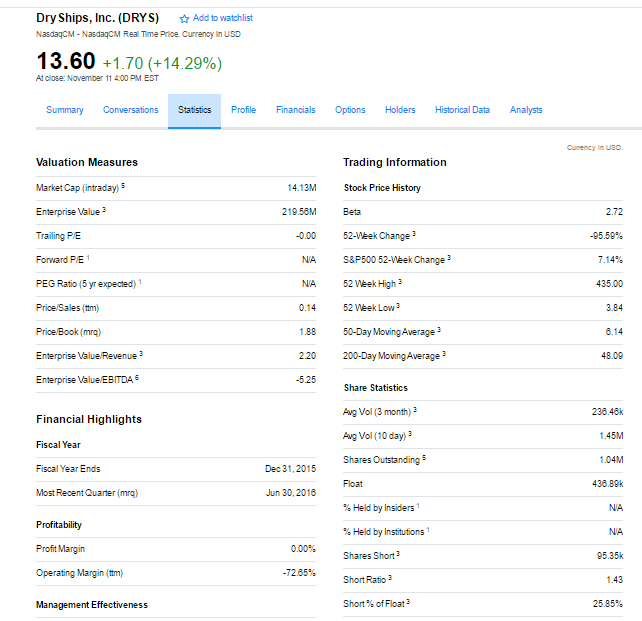
(source: YAHOO Finance!)
We had a catalyst, coupled with some fundamental facts about the stock. Specifically, there was a small float, about a million shares outstanding, and a high short interest, that helped drive the stock price higher.
Generally, when you have such a dramatic move in a stock, traders will look for comparable companies to piggyback off of.
In this example, Eagle Bulk Shipping Inc. (EGLE) shared some similar characteristics. It was trading under $10 per share, and in the same sector. With that said, some traders may feel they missed the move in DryShips, and look to pile into the next best thing. That week, Eagle Bulking Shipping closed more than 42% higher.
This strategy of piling into similar companies to ride the momentum of the hot blue chip stocks is called the sympathy play.
How can you use the sympathy play to profit?
Well, the first example is based on one stock really generating a lot of momentum and just finding something in the same space. But it doesn’t have to always be off an extreme move.
For example, let’s say Company A had earnings, but Company B has yet to report. One could wait for the EPS of Company A, and trade Company B off their results. If the EPS is positive, you take Company B for a long, if it’s negative, you take Company B for a short.
Another example, let’s say a very well known hedge fund is doing very poorly this year, and there are rumors that he might be facing redemptions or closing down the fund soon. Traders might start attacking his positions, even if there isn’t any news in those blue chip stocks.
On the other hand, let’s say a well known hedge fund manager is on a hot streak, traders might start buying stocks that they have on, hoping that they would appreciate in value.
Generally, you should be careful when relationships are loose, but volatility does create opportunities in the market.
The key is to be aware of companies, the sectors they are in, who their competitors are and see if you can take advantage of the sympathy play. As you’ve seen, there are a number of different ways that this strategy can be employed. These were just a couple of examples for you to get acclimated with the strategy regarding blue chip stocks.
How News Helps With Trading Hot Penny Stocks
We live in a world where algorithmic trading dominate the daily volume seen in the stock market today. With that said, there are a ton of news reading algos that react to headlines instantaneously, causing tremendous volatility in the company’s referenced in the stories, especially hot penny stocks.
Some traders who rely on technical indicators to make decisions will totally dismiss news all together. Their belief is that the news is already priced into the stock and the price action will dictate where it will go. They feel it’s extremely difficult to quantify the impact of the news so it’s more or less a waste of time to follow it.
Does this philosophy make sense, and how important should following the news be when trading hot penny stocks?
Let’s say the stock price of company ABC has had support at $15, if it were to drop to that level, a trader relying solely on technical analysis will buy some shares. The  stock price drops from $17 down to $15, the trader goes long, and the stock quickly drops another $3. It turns out that a news story broke out that ABC is under investigation for accounting fraud and that the CEO has left the country.
Here is a situation where there is a dynamic change in the company’s fundamentals. If you’re an investor, you’re thinking worst case scenario, you’re not necessarily thinking about support and resistance levels. You’re mind is thinking, get out, and ask questions later.
Clearly, in a situation like this, knowing the news can be very helpful when trading hot penny stocks.
Let’s say you trade style utilizes a mean reversion strategy, and company ABC is down $6 and on average it trades in a range of $2. Again, not knowing the news, you might decide to buy some shares. However, if you paid attention to the news, you would have known they just announced their earnings and that additional volatility is not unusual.
This is another example where the news helps in making better trading decisions.
Now, you don’t have to try to quantify everything to make knowing the news useful. For example, let’s say a well known analyst upgrades company ABC and their stock price gaps up on the open. What is the upgrade worth? It’s really hard to say, clearly a positive sign, but hard to measure the impact.
Does that mean having that information is useless? Absolutely not – especially with penny stocks.
It’s when you try to overanalyze the news, in this case, it can causes problems in  your trading. For example, let’s say Company ABC has announced that are expanding their business to more regions, this might be seen as a positive news. However, it might not be reflected in their stock price right away.
Letting your opinion get in the way can also be an issue. For example, this is good news, the stock price should be going up…or this is really bad news, the hot penny stock price should be crashing.
With that said, it’s still better to be aware of the headlines and what is going on in the stock you’re trading. Sure, it’s very difficult to trade off the news, and not what is being suggested here. But including the news in your decision making process is a choice many traders make and they fare better when trading hot penny stocks.